Why investors are grappling with a ‘fear of heights’ in 2024 — and what 98 years of history tells us

Feeling acrophobic?
After the S&P 500’s 26% return last year and this year’s strong start, many investors are worried – understandably – that this bull run is getting ahead of itself.
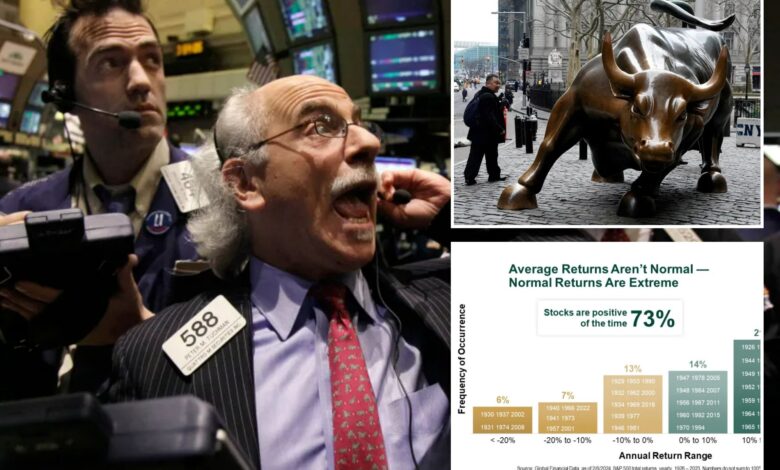
They shouldn’t. The strange-but-true fact is that, statistically speaking, average returns — which have amounted to about 10% a year over nearly a century of trading — aren’t normal in the stock market for any given year. A second, surprisingly pleasant fact is that so-called “extreme” returns are far closer to what we’d call normal — and they’re mostly on the positive side.
Most folks think of volatility as negativity. We all recognize the NYSE’s famously frazzled-looking floor trader, Peter Tuchman, peering up at the Big Board in various states of alarm, with the effect enhanced by his Einstein-style shock of white hair.
Crucially, that image – however familiar, convincing and relatable it may be – is misleading. Volatility is just movement, whether it’s up or down.
Crunching the numbers, one finds that stocks rise far more often than they fall. Forget the day-to-day or month-to month noise. Since accurate data start in 1925, the S&P 500 gained in fully 73% of rolling 12-month periods – nearly three-quarters of them! Stretched to rolling five-year periods that becomes 88%. Across 10-year periods, it’s a staggering 94.5%.
Meanwhile, throughout that entire, 98-year stretch, there has never been a rolling 20-year period of negative returns. Never.
To work this into your bones a little further, consider that since 1925, US stocks gained more than 20% in 37 of 98 calendar years — the most frequent result! Next most frequent? Zero to 20% gains, totaling 35 times. Down between 0% and -20% followed, at 20 years.
Down big was the real rarity, occurring just six times. So, markets posted huge gains six times as often as horrendous declines.
More simply: Stocks beat their 10% long-term average in 58 calendar years. They fell — to any degree — less than half as often, 26 times. So historically, you are more than twice as likely to celebrate above-average, even huge, years than encounter down years.
Looking back at the past five years, many folks – again, understandably – fixate on 2022’s negativity, calling that “volatile.” OK! But what of all the great volatility during 2019’s 31.5% boom? Or 2021’s 28.7%? And, of course, 2023. All four years are extremes.
Even 2020, starting dreadfully amid COVID’s lockdown-driven hyper-fast bear market, finished up 18.4%. I hesitate labeling anything in 2020 normal. But ironically, its 18% return is the closest to average among those years.
The upshot? Big returns simply aren’t the rarity that “too far, too fast” bears claim. In bull markets, they are more normal than not. Why? The roughly 10% long-term annual average includes bear markets. Strip out the bears and you’ll find that during the 14 S&P 500 bull markets before this one, stocks annualized 23%.
Mind you, I’m not necessarily suggesting 2024 returns exceeding 20%. But it wouldn’t shock me — and it shouldn’t shock you. The fact is, gains of 20% and more aren’t abnormal at all.
As for acrophobia, I can’t disagree with a fear of hot-air balloons, mountain climbing, or a job washing windows at the Empire State Building – but try to get over it when it comes to investing.
Ken Fisher is the founder and executive chairman of Fisher Investments, a four-time New York Times bestselling author, and regular columnist in 21 countries globally.


